Two lessons, one story. Here it is on one page before we take the next step.
flowchart TD
  A["1974<br/>Molina and Rowland predict<br/>that CFCs will destroy ozone.<br/>Nothing has been measured"] --> B["1975<br/>Industry answers:<br/>there is no hard data"]
  B --> C["Two instruments watch<br/>the Antarctic sky"]
  C --> D["Halley, from 1956<br/>A Dobson instrument measures<br/>the ozone above one spot"]
  C --> E["Nimbus-7, from October 1978<br/>A NASA satellite measures<br/>the whole continent"]
  D --> F["Early 1980s<br/>Halley's spring readings<br/>keep falling. Only the<br/>Survey has seen them"]
  E --> G["June 1984<br/>The October 1983 readings<br/>are processed. Many are<br/>flagged as too low to be real"]
  G --> H["1984<br/>The trusted check at the<br/>South Pole says nothing<br/>is wrong. It is itself wrong"]
  H --> I["October 1984<br/>New South Pole readings<br/>agree with the satellite"]
  F --> J["Today<br/>Two records both say<br/>something is wrong.<br/>Who tells the world, and when?"]
  I --> J
The first lesson asked whether a claim can count as scientific before there is any evidence for it. The second asked whether an instrument can show us something we are not expecting. Today the story leaves the instruments and goes into print.
Last lesson ended with a question mark in the last row of the timeline. The answer was being worked out in an office in Cambridge, England.
The Halley readings you saw last lesson belonged to the British Antarctic Survey. The measurements were made in Antarctica, but the numbers came back to the Survey's headquarters in Cambridge on paper, by ship, and a full season's readings could take more than a year to arrive. Three people there were working through them: Joe Farman, who ran the group; Brian Gardiner; and Jonathan Shanklin, a young physicist who had joined in 1977 to write the computer programs that turned the readings into ozone figures.
At a Survey open day in the early 1980s, Shanklin put up a display comparing that year's ozone figures with figures from a decade earlier. There had been worries in the news that spray cans, and Concorde, the supersonic airliner that flew high in the stratosphere, might damage the ozone layer. He expected the two sets of figures to match, which would reassure the public. They did not. His boss thought it might be a one-off.
Jonathan Shanklin, "The Discovery of the Antarctic Ozone Hole," Back to the Future: 1979–1989, National Library of Scotland, https://digital.nls.uk/1980s/science-technology/ozone-hole/.
Jon Shanklin, comment of 2 January 2018 on Gavin Schmidt, "What Did NASA Know? And When Did They Know It?," RealClimate, 24 December 2017.
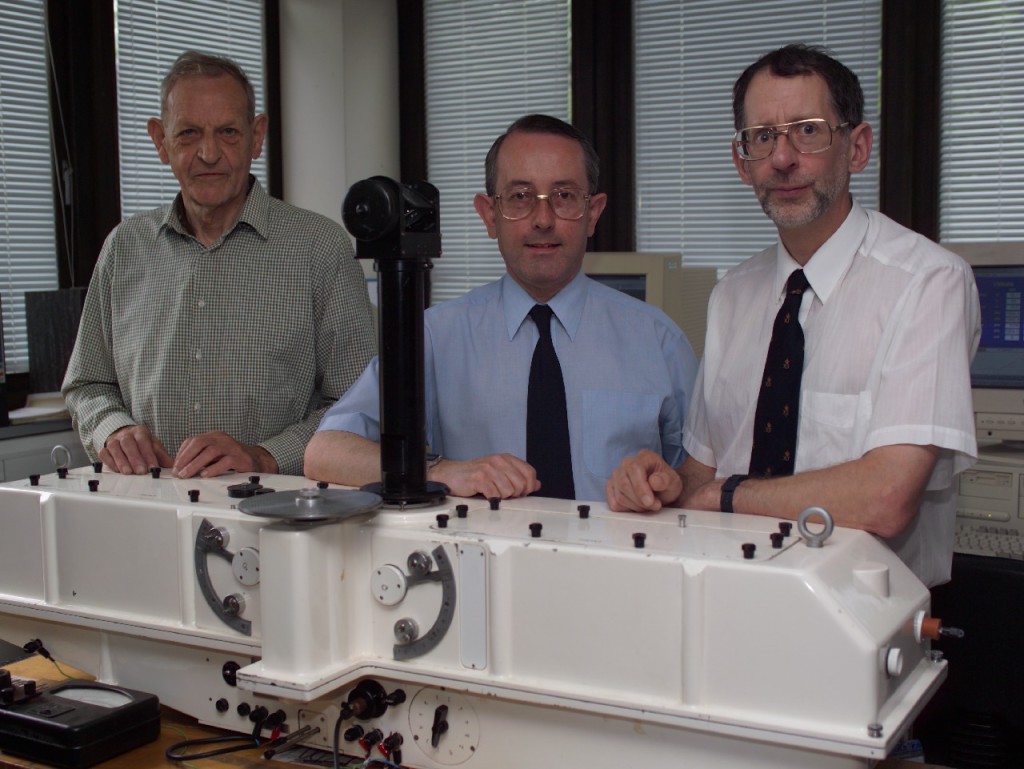
From left: Joe Farman, Brian Gardiner and Jon Shanklin with a Dobson ozone spectrophotometer, the instrument used to measure stratospheric ozone at Halley. British Antarctic Survey. Source
It is now 1984, and you are on the Halley team. This is what your team knows.
| What you know | |
|---|---|
| The readings | Every spring, the ozone over Halley is lower than it used to be. You saw the October averages last lesson: just over 300 Dobson units in the late 1950s, then falling through the 1970s and early 1980s. |
| The instrument | The early low readings came from an instrument that had been in use for years, and instruments like it are hard to keep working in the Antarctic cold. In the Antarctic summer of 1981 to 1982, Shanklin took a brand-new one to Halley and checked it against the old one. The low spring readings carried on. |
| The second station | Your team's other station, Faraday, in the Argentine Islands off the Antarctic Peninsula, is well over 1,500 kilometres from Halley. Its spring readings are falling too. |
| The backlog | Years of old readings are still waiting to be turned into ozone figures. Until they are, you cannot be sure whether you are looking at a steady trend or a run of odd years. |
| The satellite | NASA's satellite has measured the ozone over the whole of Antarctica since 1978. Nobody has reported anything unusual. Shanklin has written to an American centre that handles satellite ozone data, asking whether the satellites are seeing low values too. No reply has come. A satellite watching the whole continent every day, and seeing nothing, is hard to argue with. |
| The theory | The best computer models say CFCs will change the ozone layer only slightly for at least another ten years, and that the first damage should show up high above the tropics, not over Antarctica. |
| The explanation | Nobody, including your team, can yet say why ozone would fall over Antarctica, and only in spring. |
Publishing means sending the readings to a journal such as Nature. As you saw in the first lesson, other scientists in the same field read the paper and try to find holes in it before it is printed.
✍️ Write here, on your own. Do not discuss this until everyone has finished, and do not change your answers once you read on.